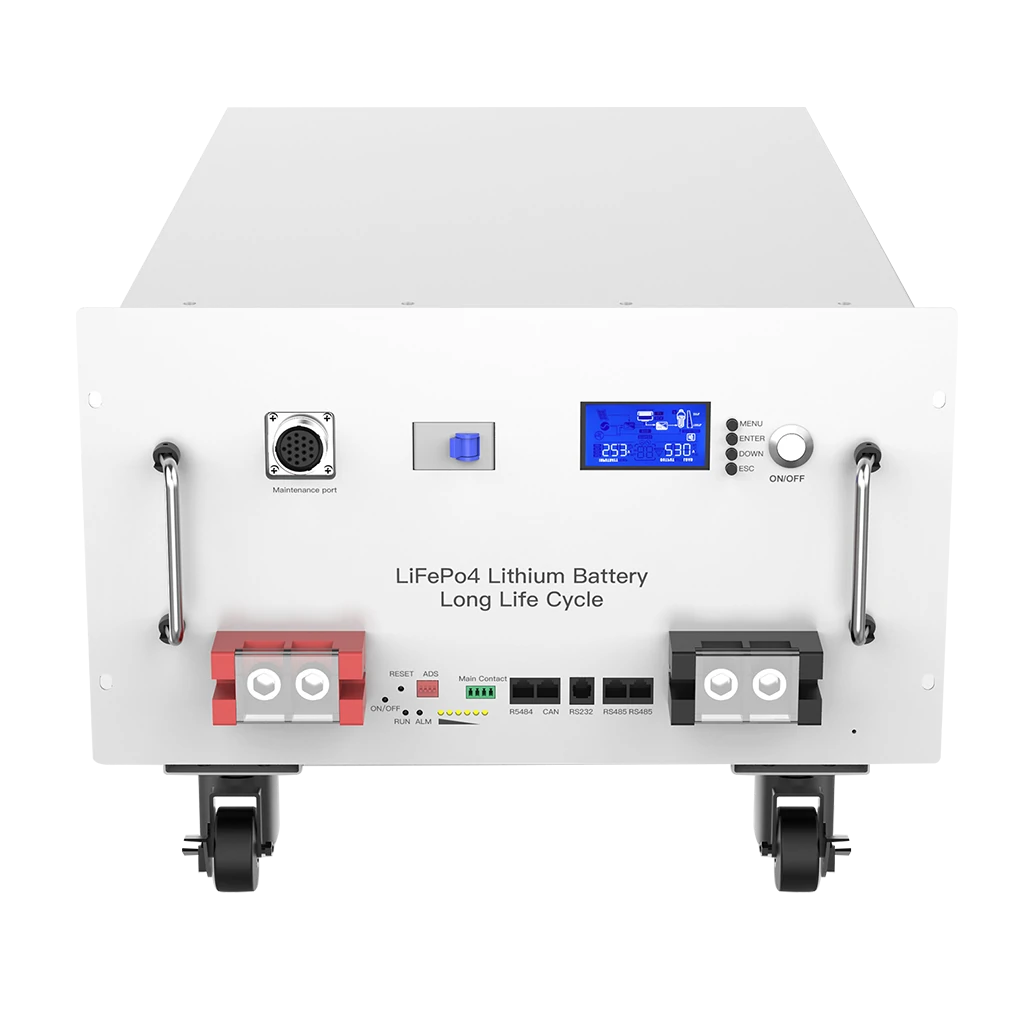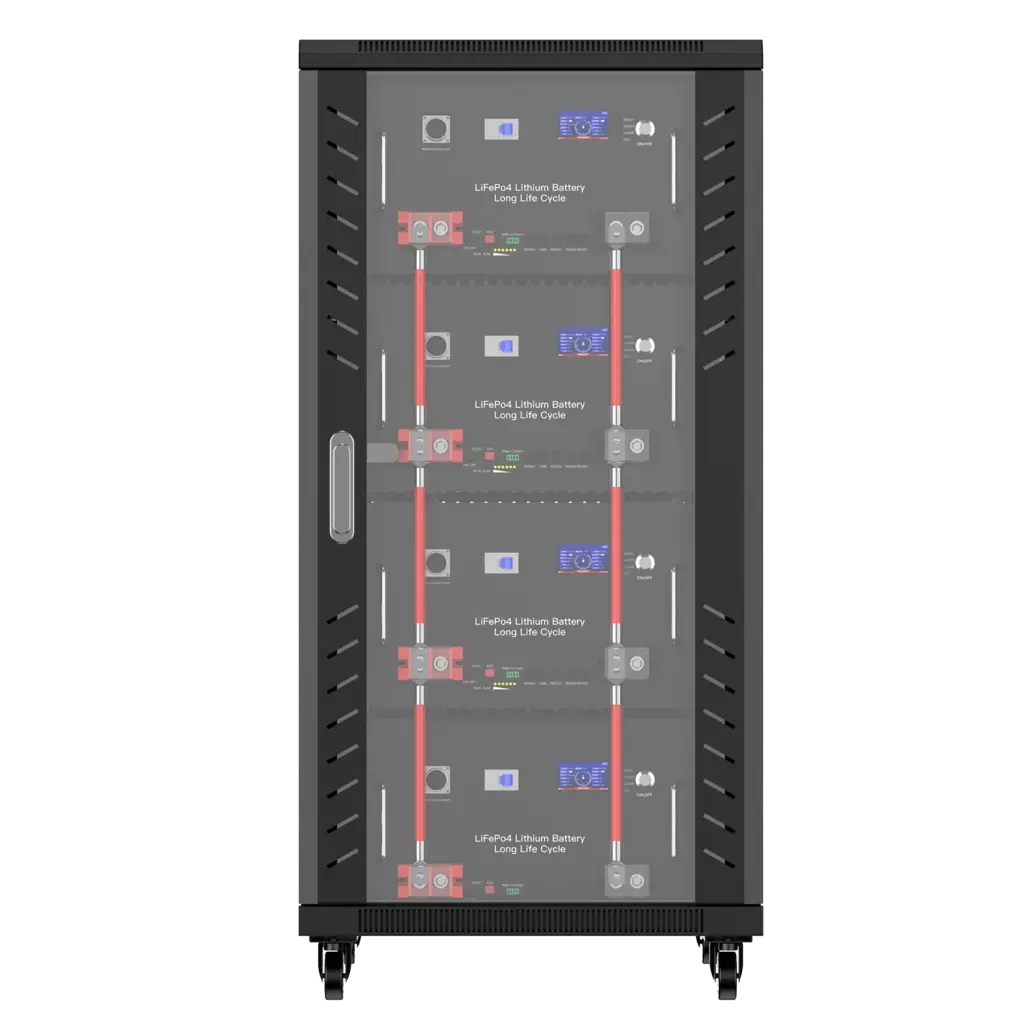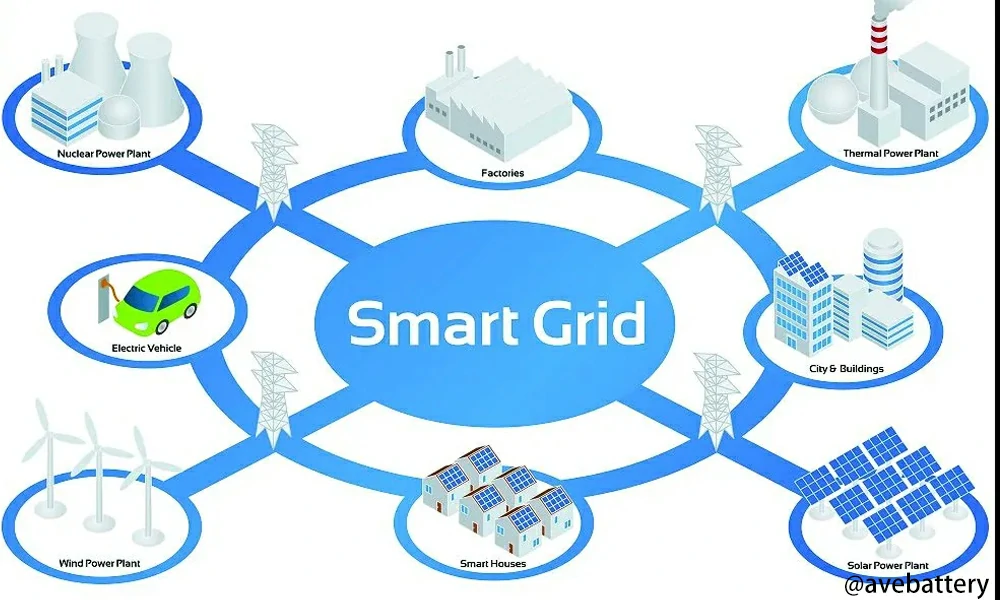

Conversion efficiency is the percentage of input electrical power or energy that remains as useful output after a conversion stage: efficiency = output ÷ input × 100. In a battery energy storage system (BESS), PCS and inverter conversion pathways commonly operate in the mid-to-high 90% range under favorable conditions, but this is not the same as battery round-trip efficiency or whole-system efficiency.
How Is Conversion Efficiency Calculated?
Conversion efficiency is calculated by dividing useful output power or energy by input power or energy and multiplying by 100. Power-based efficiency describes one operating point, while energy-based efficiency over a defined period is more useful when load and power levels vary.
For instantaneous electrical power:
Conversion Efficiency (%) = Output Power ÷ Input Power × 100
If a PCS receives:
- Input power: 100 kW
- Output power: 97 kW
then:
97 ÷ 100 × 100 = 97%
The conversion loss is:
100 kW − 97 kW = 3 kW
For operation over time, use energy instead:
Energy Conversion Efficiency (%) = Output Energy ÷ Input Energy × 100
For example, if 100 kWh enters a converter and 96 kWh leaves it:
96 ÷ 100 × 100 = 96%
What Is a Good Conversion Efficiency for a Battery Energy Storage System?
A good conversion efficiency depends on the conversion path being measured. For modern battery-storage power electronics, mid-to-high 90% efficiency under normal operating conditions is a useful reference range, but the same percentage cannot be applied to complete round-trip efficiency.
Real-World BESS Efficiency Benchmarks
| Reference | Measurement | Reported Result | How to Interpret It |
|---|---|---|---|
| HTW Berlin Energy Storage Inspection 2026 | Average PV-to-AC conversion | 96.7% | Average across the tested residential systems with available data |
| HTW Berlin Energy Storage Inspection 2026 | Average PV-to-battery conversion | 96.5% | Measures the solar charging conversion path |
| HTW Berlin Energy Storage Inspection 2026 | Average AC-to-battery conversion | 96.6% | Measures grid/AC charging conversion |
| HTW Berlin Energy Storage Inspection 2026 | Average battery-to-AC conversion | 96.2% | Measures battery discharge conversion |
| HTW Berlin Energy Storage Inspection 2026 | Leading 10 kW system | >97.6% average conversion efficiency; 4 W standby | High-performing residential system under the study’s test method |
| HTW Berlin Energy Storage Inspection 2026 | Lowest-ranked system | 89.3% SPI; 64 W standby | Shows how conversion and standby losses can materially affect system performance |
| NREL 2024 ATB | Battery storage round-trip efficiency | 85% | Representative modeling assumption, not a universal converter-efficiency specification |
Conversion Efficiency vs. Inverter Efficiency vs. Battery Efficiency vs. Round-Trip Efficiency
Conversion efficiency normally measures one electrical conversion stage, while battery efficiency measures losses within the battery and round-trip efficiency measures energy recovered after a complete charge-and-discharge process.
| Metric | Typical Measurement Boundary | What It Measures | Best Used For | Main Limitation |
|---|---|---|---|---|
| Conversion efficiency | Input and output of one converter | AC/DC, DC/AC or DC/DC conversion | Comparing PCS or converter performance | Does not represent the complete battery system |
| Inverter efficiency | DC input to AC output, or sometimes bidirectional conversion | Inverter power conversion | Inverter selection | Peak value may not represent normal operation |
| Battery DC efficiency | Battery DC terminals | Electrochemical and battery-side energy losses | Comparing battery performance | Excludes AC conversion |
| Round-trip efficiency | Defined charge-to-discharge boundary | Energy returned compared with energy supplied | Storage comparison | Boundary can be DC-DC or AC-AC |
| Whole-system efficiency | Site-defined system boundary | Batteries, PCS and possibly auxiliaries and transformers | Project economics | Only comparable when boundaries are identical |
For a deeper explanation of electrochemical and battery-side losses, see Avepower’s Battery Efficiency guide.
For inverter-specific efficiency curves and weighted ratings, see What Is Inverter Efficiency?.
How Does Conversion Efficiency Change With Load?
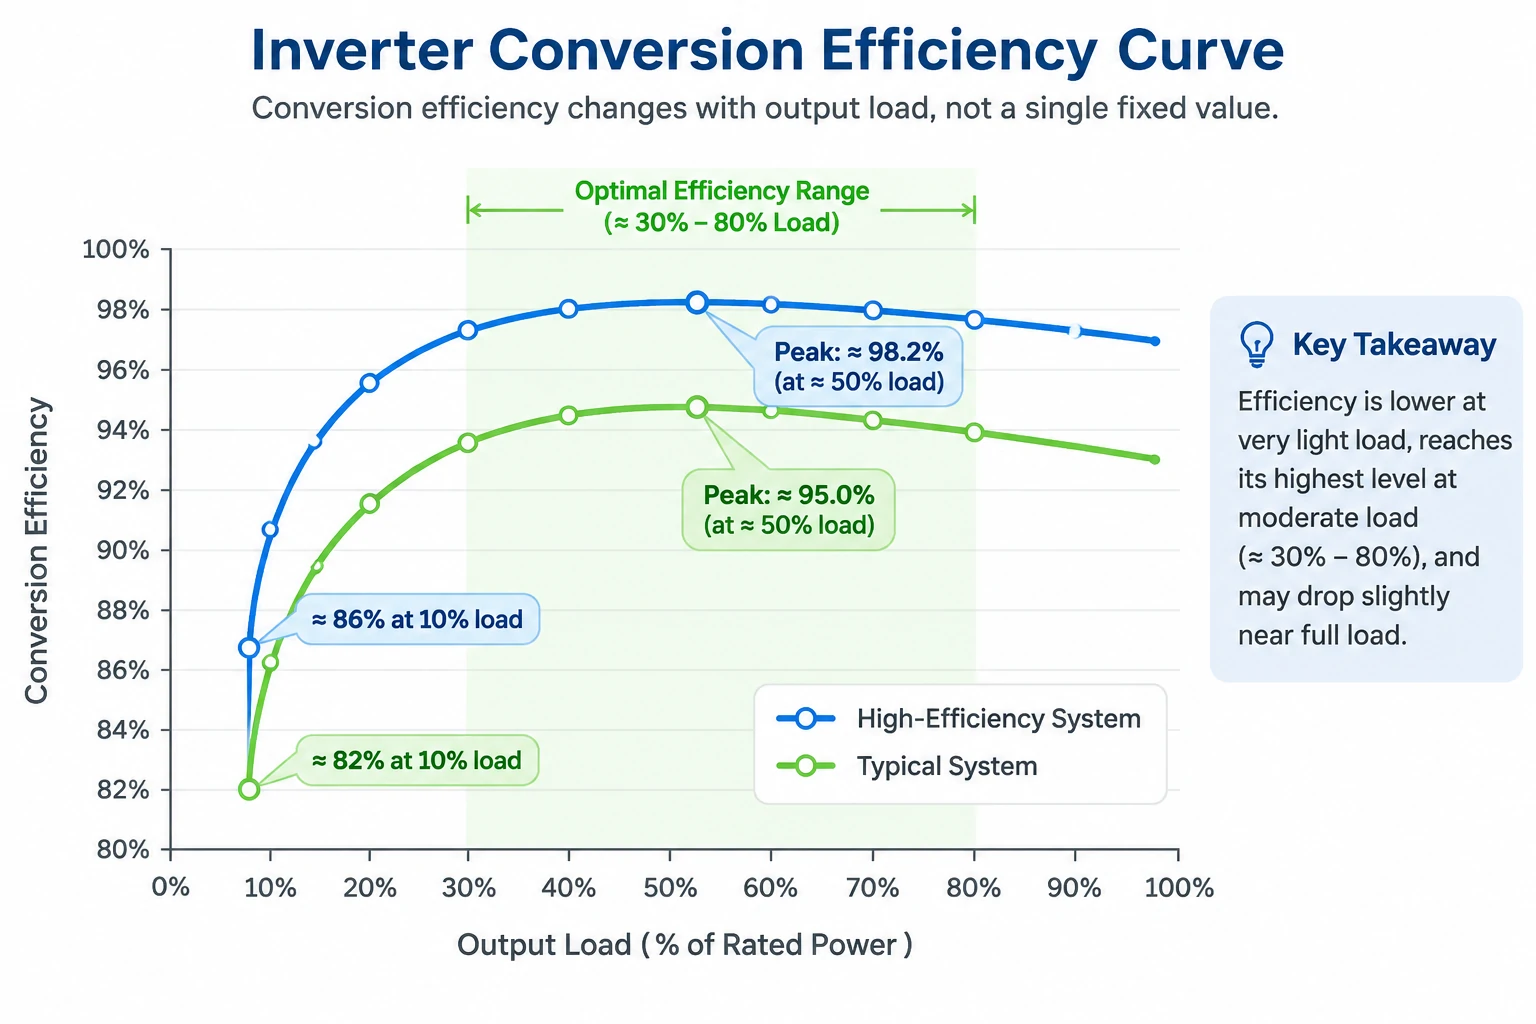
Conversion efficiency is usually lower at very light load because control electronics, switching circuits, communications, and other fixed losses still consume power even when useful output is small. Efficiency normally rises as load increases toward the converter’s efficient operating region, although it may decline again near thermal or operating limits.
This is why a PCS with a 98% peak efficiency rating does not necessarily operate at 98% throughout the day.
A system that spends many hours delivering only a small fraction of rated power can lose more energy than another system with a slightly lower peak rating but better part-load performance.
When comparing PCS or inverter specifications, check:
- efficiency at multiple load points;
- charging and discharging curves;
- standby or no-load power;
- DC voltage used during testing;
- operating temperature;
- maximum versus weighted efficiency.
Peak efficiency should be treated as one point on an efficiency curve, not as an annual system-efficiency estimate.
Where Does Conversion Loss Occur in a Battery Energy Storage System?
Conversion loss occurs whenever electricity passes through power electronics or resistive components. A BESS may include DC/DC conversion, AC/DC charging, DC/AC discharging, transformer losses, cable losses, and auxiliary consumption, so total system efficiency is the product of multiple stages rather than one efficiency percentage.
A simplified solar-plus-storage energy path may look like this:
Solar PV → DC/DC conversion → Battery → PCS/Inverter → Transformer → AC Load or Grid
A grid-charged battery can follow:
Grid AC → PCS AC/DC → Battery → PCS DC/AC → Transformer → Load/Grid
Every additional stage can reduce the usable energy.
If two conversion stages are each 97% efficient, their combined efficiency is not 97%.
It is:
0.97 × 0.97 = 0.9409
or:
94.09%
This multiplication rule is one of the most important concepts when evaluating an energy-storage architecture.
Power Semiconductor Losses
Switching devices such as IGBTs, MOSFETs, and related power electronics lose energy during switching and conduction.
The loss normally appears as heat and changes with current, switching frequency, device design, voltage, and temperature.
Cable, Busbar, and Connection Losses
Electrical resistance creates heat according to the relationship:
P loss ≈ I²R
This explains why current matters.
For the same power, increasing system voltage reduces current:
P = V × I
Lower current can reduce resistive losses in cables, busbars, connectors, and some battery-system components.
Higher voltage does not automatically guarantee a more efficient BESS, however. Converter topology, component ratings, insulation requirements, battery architecture, and operating load still matter.
Transformer Losses
Grid-connected C&I systems may include transformers between the PCS and utility connection.
Their losses should be included when the project economics are calculated at the point of interconnection rather than only at the PCS terminals.
Auxiliary and Standby Consumption
A BESS can consume energy even when it is not actively moving useful energy.
Auxiliary loads can include:
- BMS and EMS electronics
- pumps and fans
- liquid cooling
- heaters
- communications
- fire-protection electronics
- monitoring equipment
- displays and control power supplies
How Much Energy Is Lost at 90%, 95%, or 98% Conversion Efficiency?
Conversion loss can be calculated directly from input energy. With 100 kWh entering a single conversion stage, a 90% efficient converter delivers 90 kWh, while a 98% efficient converter delivers 98 kWh. Even a small percentage difference can become significant when hundreds of megawatt-hours pass through a BESS each year.
| Conversion Efficiency | Input Energy | Useful Output | Conversion Loss |
|---|---|---|---|
| 90% | 100 kWh | 90 kWh | 10 kWh |
| 95% | 100 kWh | 95 kWh | 5 kWh |
| 96% | 100 kWh | 96 kWh | 4 kWh |
| 97% | 100 kWh | 97 kWh | 3 kWh |
| 98% | 100 kWh | 98 kWh | 2 kWh |
| 99% | 100 kWh | 99 kWh | 1 kWh |
For example, consider a conversion stage processing 500 MWh per year.
At 96% efficiency:
500 MWh × 0.96 = 480 MWh useful output
At 98% efficiency:
500 MWh × 0.98 = 490 MWh useful output
The difference is:
10 MWh per year
If that delivered electricity is worth an assumed $0.15/kWh, the illustrative annual energy-value difference is:
10,000 kWh × $0.15 = $1,500
Why Can Peak Conversion Efficiency Be Misleading?
Peak conversion efficiency describes the converter at a favorable operating point, not necessarily the conditions in which the system will spend most of its life. Low-load operation, idle consumption, temperature, battery voltage, and changing charge or discharge power can all reduce actual energy efficiency.
A 100 kW PCS that frequently supplies only a few kilowatts may operate in a very different efficiency region from one that regularly operates closer to its efficient working range.
What PCS Size Helps Maintain Good Conversion Efficiency?
PCS sizing should be based on the site’s normal operating power as well as its maximum demand. Oversizing a PCS can cause the system to spend more time at very low relative load, where fixed losses represent a larger share of useful output.
Review the facility load profile, PV production, peak-shaving requirement, backup demand, battery voltage range, maximum charge/discharge current, expected C-rate, and the PCS efficiency curve before selecting rated power.
When Is Paying More for Higher Conversion Efficiency Worth It?
Higher efficiency is most valuable when large amounts of energy pass through the storage system frequently. It becomes less important when the battery is rarely cycled, energy is inexpensive, backup is the primary objective, or the efficiency premium compromises more important requirements such as safety, power capability, compatibility, or warranty.
Higher efficiency deserves greater weight for:
- daily solar energy shifting;
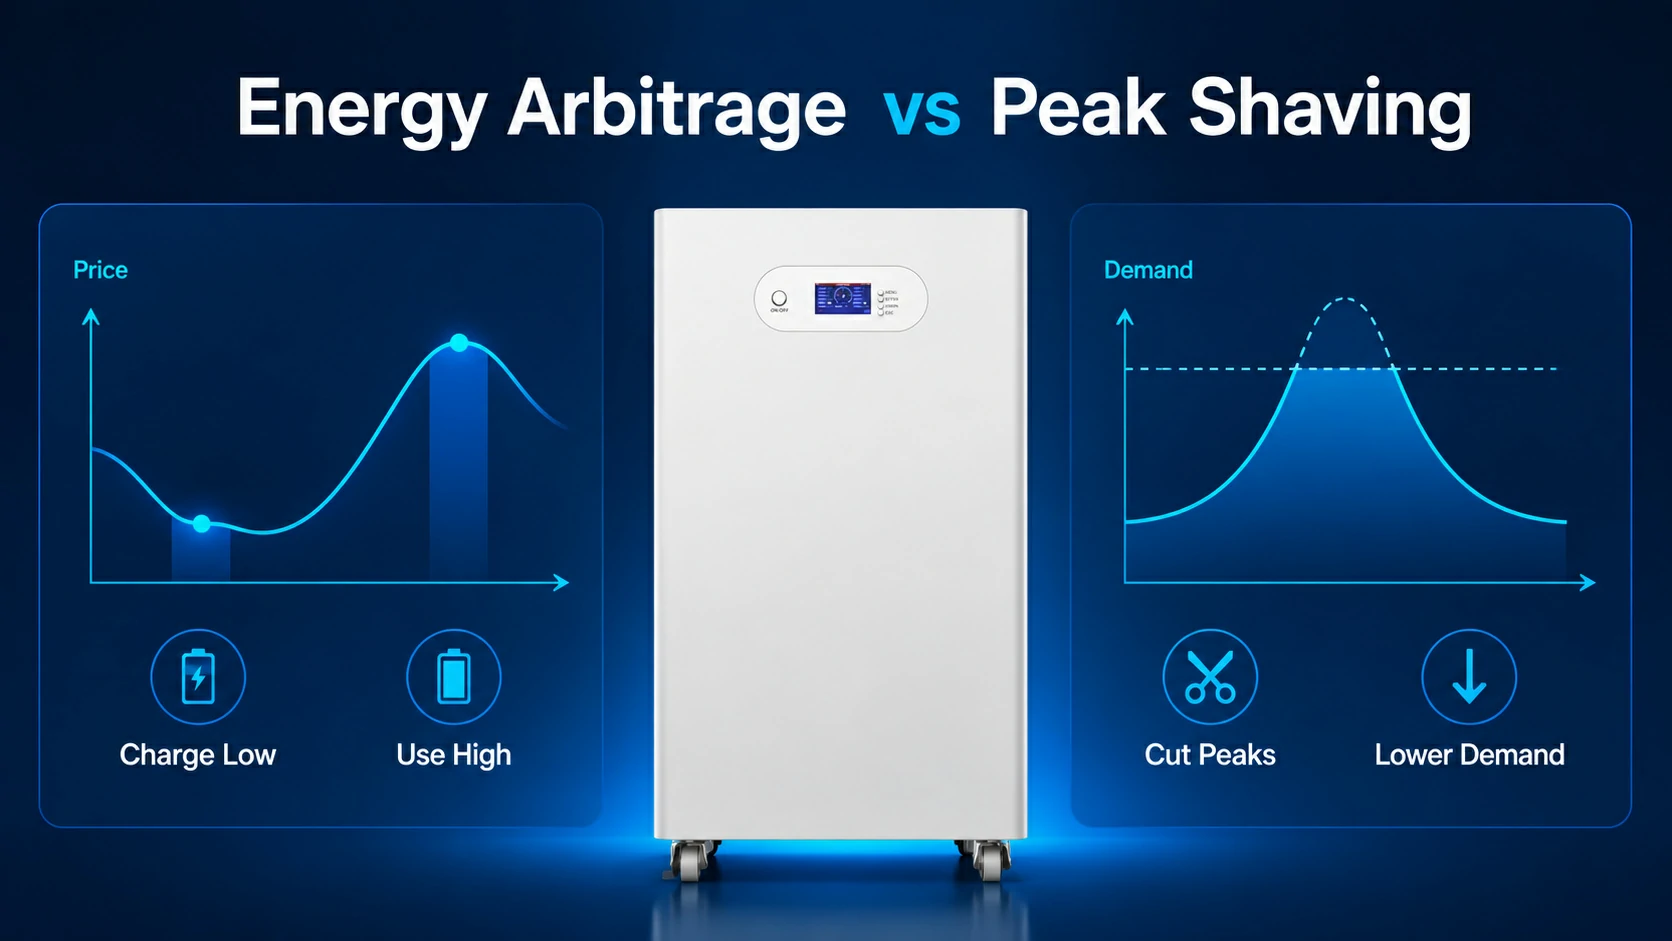
- energy arbitrage;
- frequent C&I peak shaving;
- high-throughput microgrids;
- sites with expensive electricity;
- projects where renewable generation is limited;
- installations with long operating lives.
A small efficiency difference may deserve less weight for:
- emergency-only backup;
- very low annual battery throughput;
- systems where a higher-efficiency product requires major retrofit work;
- projects where power capability or backup duration is more important;
- equipment with poor service, compatibility, or warranty support.
Do not optimize efficiency in isolation.
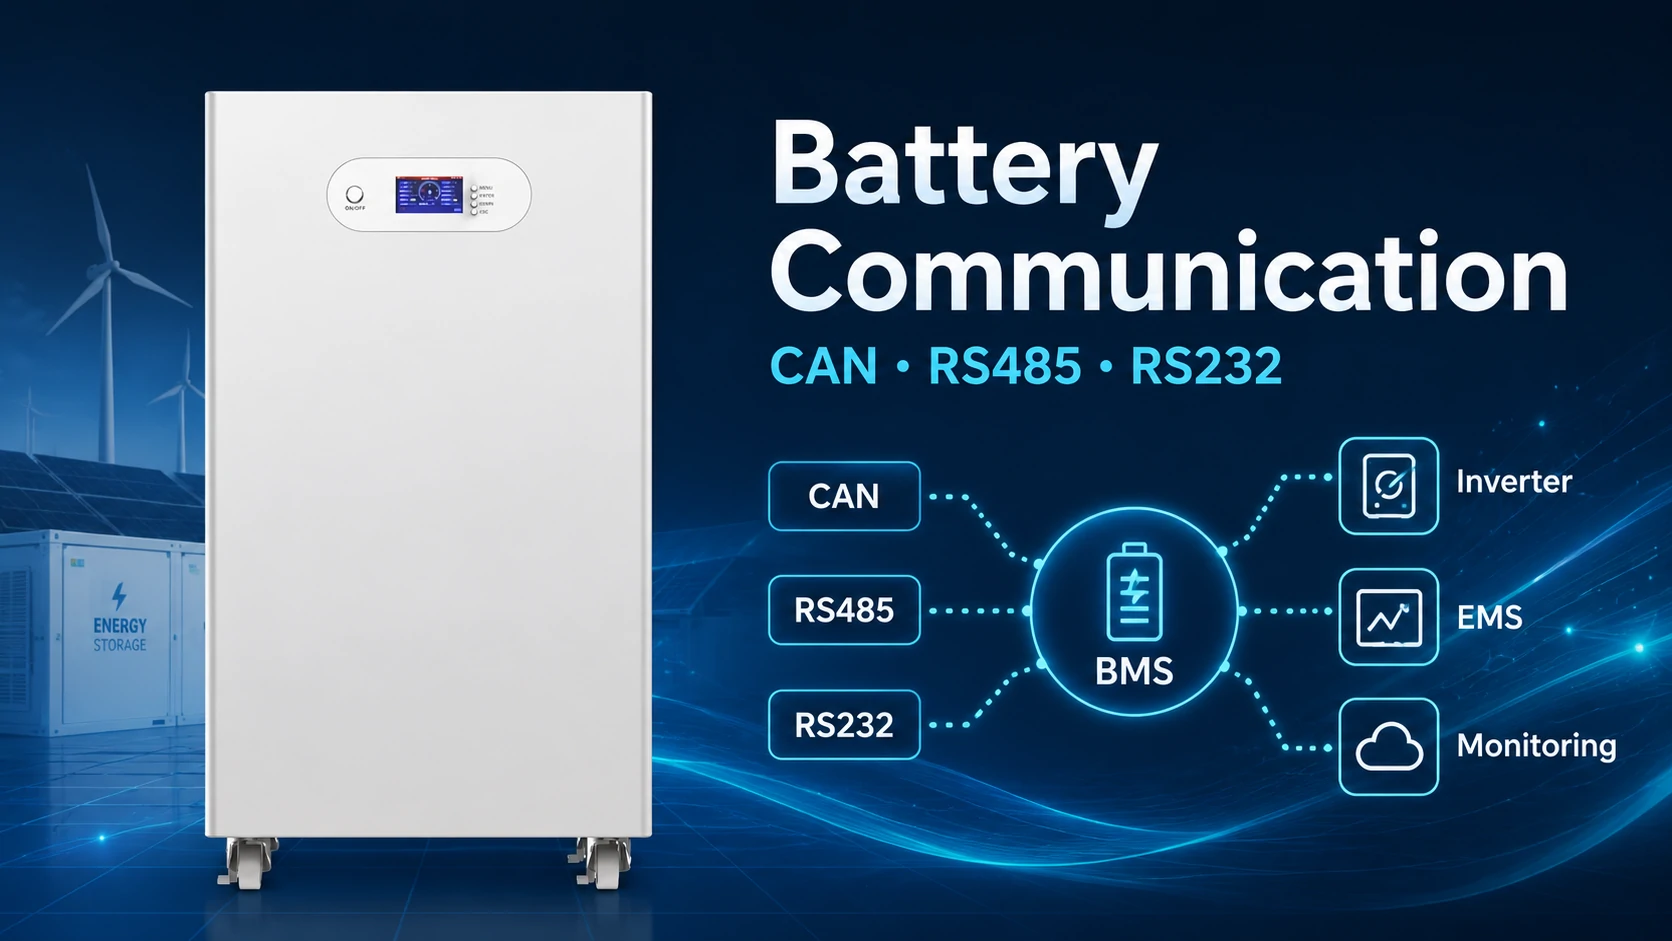
A 1% efficiency improvement is not useful if the system cannot support the required inverter communication protocol, operating temperature, power level, safety requirements, or project certification.
Plan a BESS Around Your Actual Energy Profile
Avepower supplies residential, high-voltage, and commercial LiFePO4 energy-storage systems and supports project-based battery capacity, voltage, BMS communication, PCS integration, cabinet configuration, and OEM/ODM requirements. Its published quality-control process includes cell inspection and matching, BMS testing, electrical checks, charge/discharge testing, and final inspection.
For a project-specific configuration, provide:
project country, load profile, annual electricity consumption, PV capacity, required battery capacity, required PCS power, backup duration, grid voltage, existing inverter or PCS model, ambient temperature range, application, and required certifications.
Take Control of Your Energy with Avepower!
Reliable home solar battery solutions with OEM/ODM customization and in-house manufacturing, tailored to the needs of distributors, installers, and energy partners.
FAQ
No. A 98% inverter rating normally describes one conversion stage under specified conditions. Charging conversion, battery losses, discharge conversion, standby consumption, HVAC, transformers, and other equipment can reduce complete AC-to-AC round-trip efficiency.
Real systems operate at changing loads, voltages, temperatures, and states of charge and may spend long periods in standby. Datasheet values are normally measured under defined test conditions that may not represent the site’s everyday operating profile.
Use calibrated meters at defined input and output boundaries and compare energy in with useful energy out over a representative period. Record state of charge, temperature, load, standby periods, and auxiliary consumption so the result can be reproduced and correctly interpreted.
Use the full efficiency curve and weighted performance whenever possible. Maximum efficiency tells you the best operating point, while weighted or load-dependent data provides a better indication of how the PCS may perform across changing real-world power levels.