
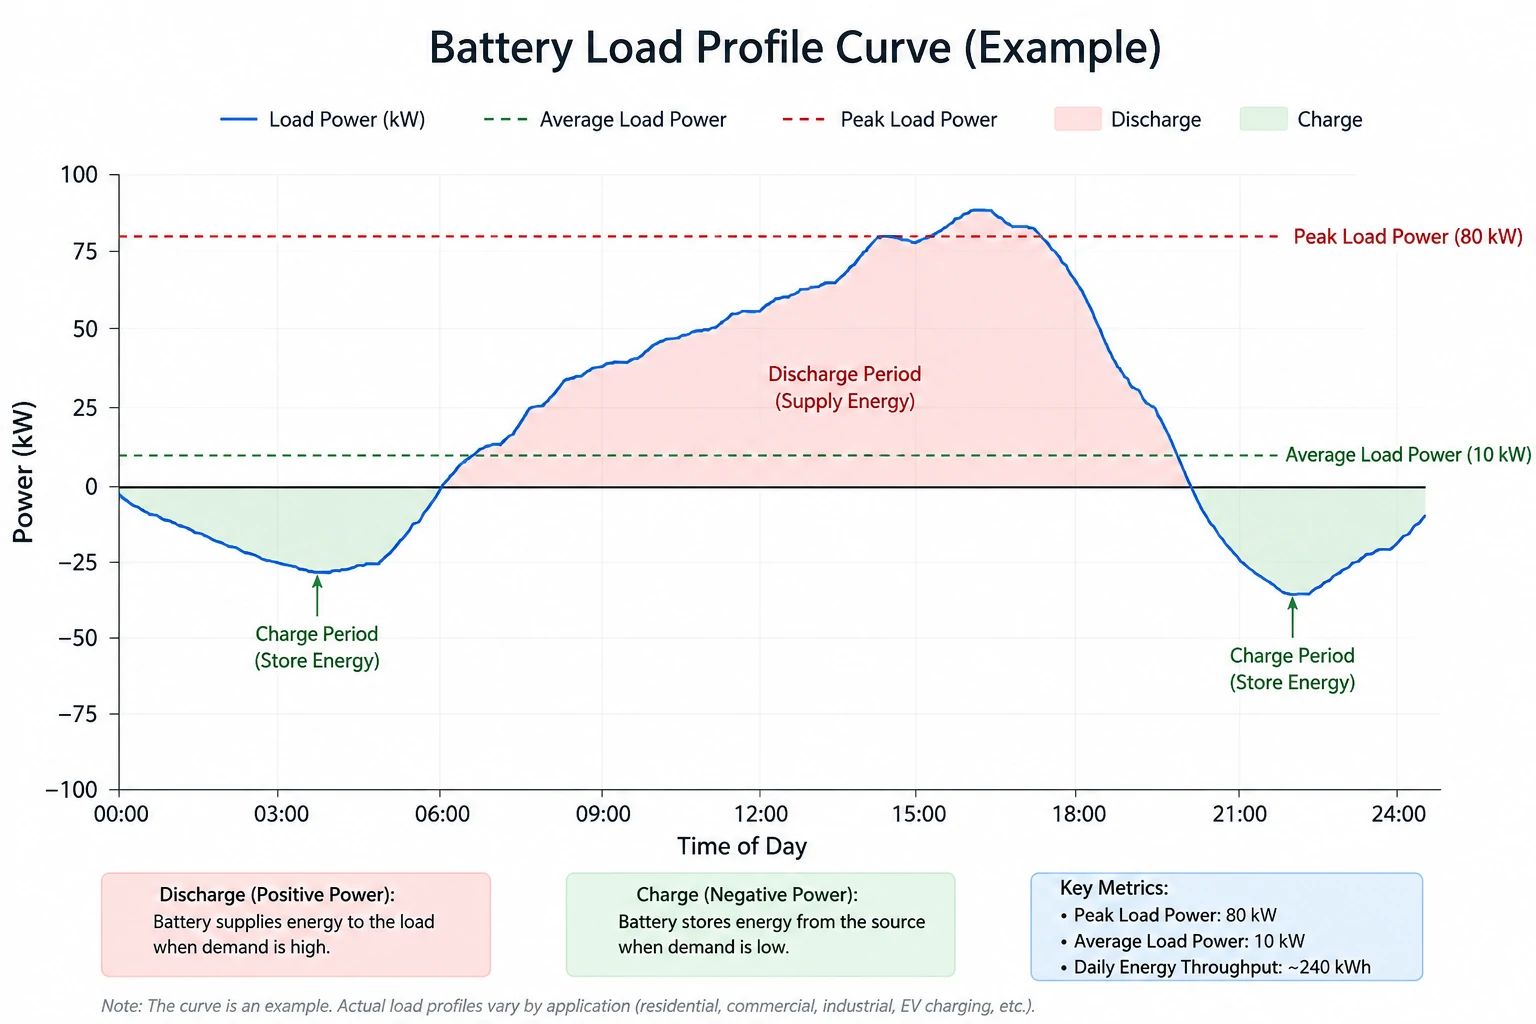
A battery load profile is the time-based record of how much power a battery must supply or absorb, when that demand occurs, and how long it lasts. For battery sizing, daily kWh alone is not enough: a technically sound profile should also reveal peak kW, current, event duration, charging windows, state of charge, operating temperature and the sequence of demanding events.
What Is a Battery Load Profile?
Short answer: A battery load profile is a chronological record of the power a battery must supply or absorb over time. It shows not only total energy demand, but also peak power, duration, operating sequence, charging periods, standby loads and, where relevant, regenerative or reverse power.
A simple profile may contain two columns:
| Time | Required Battery Power |
|---|---|
| 08:00 | 8 kW |
| 08:15 | 12 kW |
| 08:30 | 28 kW |
| 08:45 | 18 kW |
| 09:00 | 10 kW |
Why Does a Load Profile Matter More Than Total Daily kWh?
Total daily energy tells you how much electricity is consumed, but it does not tell you how quickly that energy must be delivered. Two facilities can consume the same number of kWh per day yet require completely different battery power ratings because their peaks, event duration, duty cycle and recharge opportunities differ.
Consider two loads that each consume 100 kWh:
| Load | Operating pattern | Energy | Peak power | Battery implication |
|---|---|---|---|---|
| A | 10 kW for 10 hours | 100 kWh | 10 kW | Energy-dominant |
| B | 100 kW for 1 hour | 100 kWh | 100 kW | Power-dominant |
If your equipment includes motors, pumps, compressors, cranes, elevators or other transient loads, also review the relationship between voltage, power and current in Avepower’s battery discharge current guide before treating an average load as a sufficient design input.
What Data Should a Battery Load Profile Include?
A usable battery load profile should record enough information to calculate energy, identify the highest continuous and transient power, determine recharge opportunities, and reproduce important operating conditions.
| Data field | Why it matters | Minimum use |
|---|---|---|
| Timestamp | Establishes event order and duration | All projects |
| Site/equipment load, kW | Determines required discharge power | All projects |
| Interval duration | Converts kW to kWh | All projects |
| Voltage | Converts power to current and checks operating window | Battery/system design |
| Continuous current | Checks cell, busbar and BMS limits | Battery/system design |
| Peak current | Checks startup/transient capability | Dynamic loads |
| Peak duration | Distinguishes transient from thermal continuous load | Dynamic loads |
| PV generation | Calculates net load and charging surplus | Solar + storage |
| Grid import/export | Models peak shaving and interconnection limits | Grid-connected BESS |
| SoC | Shows usable operating window and reserve | Dispatch/validation |
| Temperature | Identifies thermal derating and stress | Harsh environments |
| Charging window | Confirms battery can recover before the next event | Repeated cycling |
| Backup reserve | Prevents economic dispatch from consuming emergency energy | Resilience projects |
What Time Resolution Should You Use for Battery Load Profile Analysis?
Use the shortest interval that can capture the event that governs battery sizing. Fifteen-minute data is often a good starting point for C&I peak-shaving analysis, but it can hide second-scale motor starts or brief high-current events.
| Data resolution | Good for | Main limitation |
|---|---|---|
| Monthly bill | Early feasibility, annual energy review | Cannot reproduce peak shape or duration |
| Hourly | Rough energy shifting and preliminary modeling | Can average away short demand spikes |
| 15-minute | Many C&I tariff and peak-shaving studies | May miss short transient loads |
| 1-minute | Faster industrial load variation | Larger dataset; still may miss startup events |
| 1-second or faster | Motors, machinery, transient current validation | Usually unnecessary for long-duration energy studies |
| Multi-signal P + SoC + T | Battery testing and degradation validation | Requires battery-side measurements/modeling |
Worked Example: What Does a 15-Minute Battery Load Profile Calculation Look Like?
In this illustrative C&I example, reducing grid demand to 310 kW requires 110 kW of peak battery discharge and 75 kWh of delivered energy during the modeled event. After a preliminary efficiency, usable-SoC and design-margin adjustment, the energy screening result is approximately 96.5 kWh of nominal battery capacity.
Assume the site’s target grid demand is 310 kW.
| Time | Site load | Battery power needed | Energy for interval |
|---|---|---|---|
| 16:00 | 285 kW | 0 kW | 0 kWh |
| 16:15 | 320 kW | 10 kW | 2.5 kWh |
| 16:30 | 365 kW | 55 kW | 13.75 kWh |
| 16:45 | 420 kW | 110 kW | 27.5 kWh |
| 17:00 | 390 kW | 80 kW | 20.0 kWh |
| 17:15 | 350 kW | 40 kW | 10.0 kWh |
| 17:30 | 315 kW | 5 kW | 1.25 kWh |
| 17:45 | 295 kW | 0 kW | 0 kWh |
| Result | — | 110 kW peak | 75 kWh |
Because each interval lasts 0.25 hour:
E = (10 + 55 + 110 + 80 + 40 + 5) × 0.25
E = 75 kWh
For illustration, assume:
- discharge-path efficiency = 95%
- usable SoC window = 90%
- preliminary design/aging factor = 1.10
Then:
Enominal ≈ 75 ÷ (0.95 × 0.90) × 1.10
Enominal ≈ 96.5 kWh
Why Can a Battery Pass the kWh Check but Still Fail the Load Profile?
A battery can contain enough stored energy yet fail the application because its voltage, maximum current, PCS rating or thermal limits cannot deliver the required power.
The example above creates a useful real-product screening test.
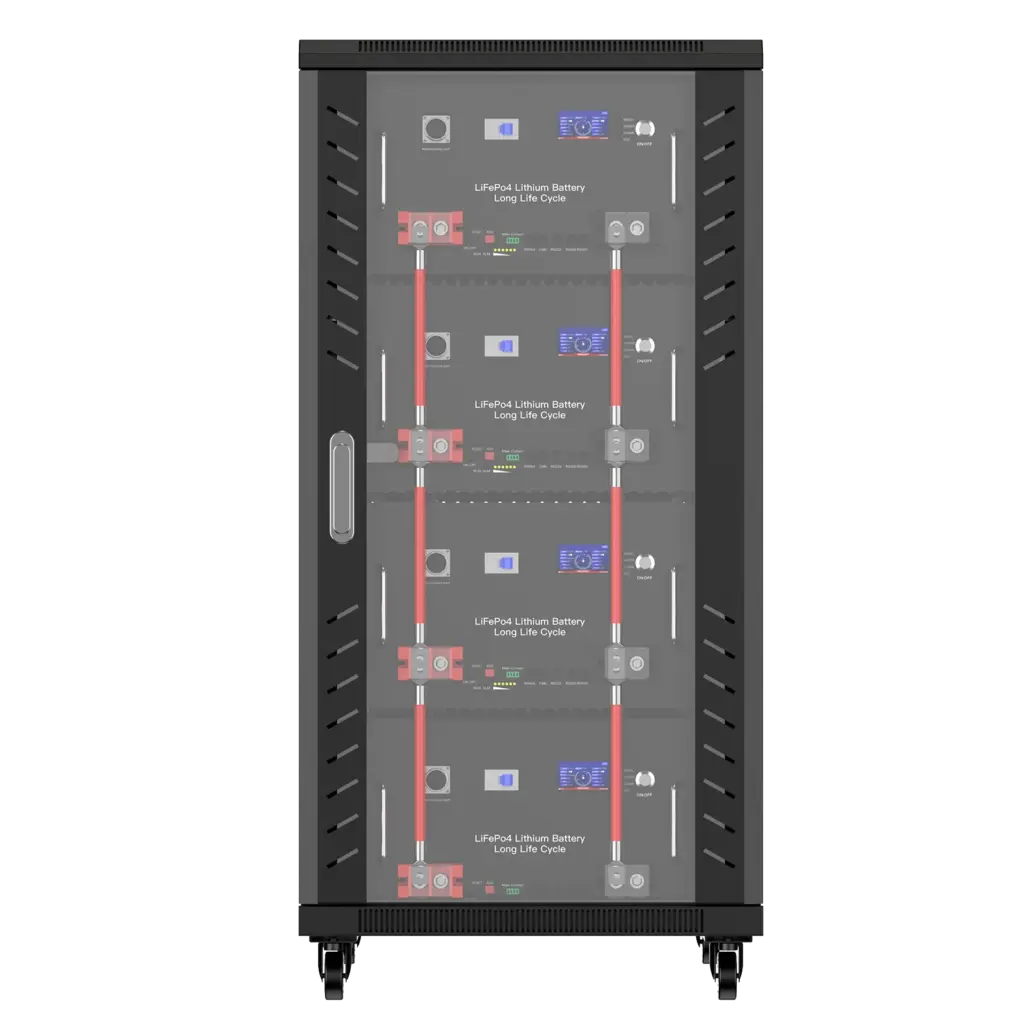
Avepower lists its 345.6 V 108 kWh high-voltage stacked battery system at 108 kWh, 345.6 V nominal voltage and 150 A discharge current.
Ignoring conversion losses for a moment:
345.6 V × 150 A ≈ 51.84 kW DC
Compare that with the illustrative load profile:
| Screening item | Example requirement | Avepower 108 kWh stack | Preliminary result |
|---|---|---|---|
| Nominal energy | ≈96.5 kWh | 108 kWh | Passes energy screen |
| Peak power | 110 kW | ≈51.84 kW ideal DC from 345.6 V × 150 A | Does not pass single-stack power screen |
| Final engineering | Required | Requires inverter/system verification | Not yet approved |
How Should You Choose a Battery From the Final Load Profile?
Do not convert the final load profile directly into a purchase order. Use it first to create a technical acceptance envelope covering required usable energy, continuous and peak power, current, voltage, recharge time, thermal conditions, SoC reserve, end-of-life performance, PCS compatibility and model-specific safety documentation.
A strong battery-selection decision therefore follows this sequence:
Measure → segment → calculate → simulate → verify → select.
The load profile tells you what the battery must do. The product specification tells you what the battery can do. The engineering review determines whether those two envelopes overlap under the worst credible operating condition.
For a high-voltage or C&I project, Avepower can use actual load data, desired kW/kWh, inverter/PCS information and country requirements as inputs for configuration review. Start with the relevant Avepower custom energy-storage service, compare real configurations against the published 108 kWh high-voltage battery specifications and C&I project case data, and confirm the exact model’s required documentation through the Avepower certification center before procurement.
Have a real load profile? Send Avepower your interval data, peak and continuous power, required backup time, inverter/PCS model and project country. The engineering team can use those inputs to screen whether a standard platform fits—or whether power, voltage, thermal or capacity requirements justify a customized LiFePO4 energy-storage configuration.
Take Control of Your Energy with Avepower!
Reliable home solar battery solutions with OEM/ODM customization and in-house manufacturing, tailored to the needs of distributors, installers, and energy partners.
FAQ
A battery load profile is a time-based representation of the power or current demand associated with a battery application. For storage sizing, it usually begins with site or equipment demand over time; after a dispatch strategy is defined, it can also describe the battery’s own charge/discharge duty.
Collect timestamped power data from a smart meter, energy-management system, power logger, inverter, PLC or equipment controller. If measurements are unavailable, divide operation into phases and estimate each phase’s power, duration and frequency, then clearly mark the assumptions.
Use enough data to capture the conditions that determine sizing. A few normal days may miss seasonal peaks, production changes or unusual demand events. C&I feasibility studies commonly benefit from long-duration interval histories, while transient equipment validation may require shorter but much higher-resolution measurements.
Power, measured in kW, describes how fast energy must be delivered. Capacity, measured in kWh, describes how much energy is stored. A battery must satisfy both requirements independently.
Use both, but for different purposes. Average or integrated load helps determine energy; peak and continuous maximum load determine power/current capability. Neither is sufficient alone.
A larger energy rating does not automatically increase PCS power or battery current capability. Check maximum continuous and peak kW, current, voltage range and BMS limits separately.